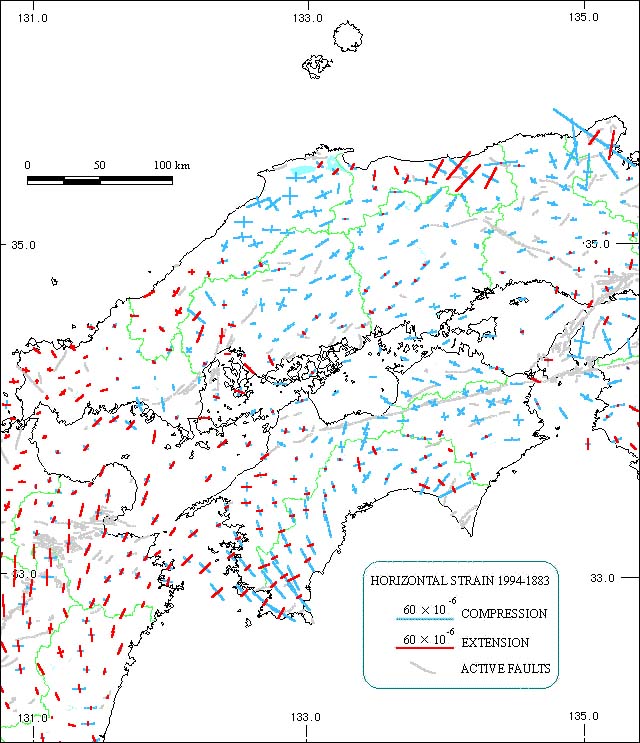
[Compiled from data from Geographical Survey Institute and 'Active Faults in Japan (Revised Edition)']
Compression is seen in a roughly east-west direction in the eastern and central part of the Chugoku region. Significant compression is seen in a northwest-southeast direction in the southwestern part of the Shikoku region. The large values in the west of Tottori City are due to the 1943 Tottori Earthquake.
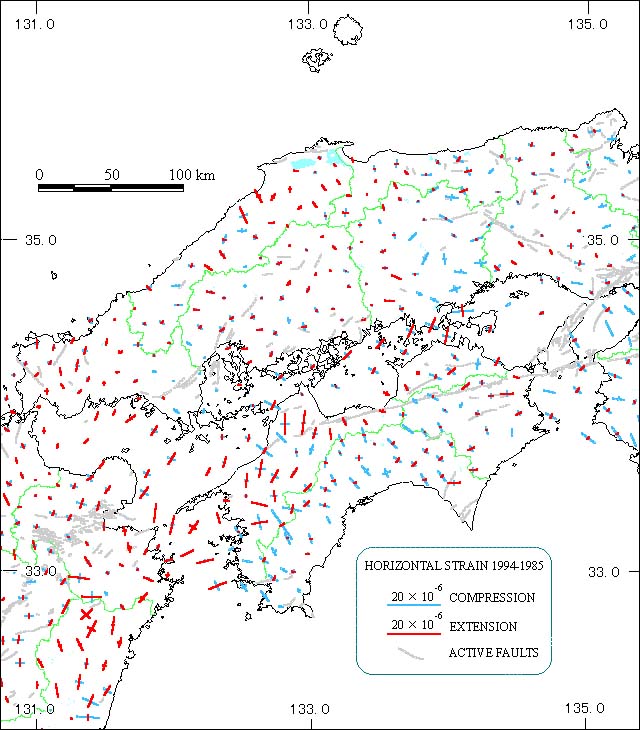
Compression is seen in a northwest-southeast direction in the Shikoku region.