Figure6-39 Distribution of aftershocks for the Earthquake near the Coast of Izu-Oshima.
(M 2 or larger, January 14 - February 13, 1978, depths of 30 km or less).
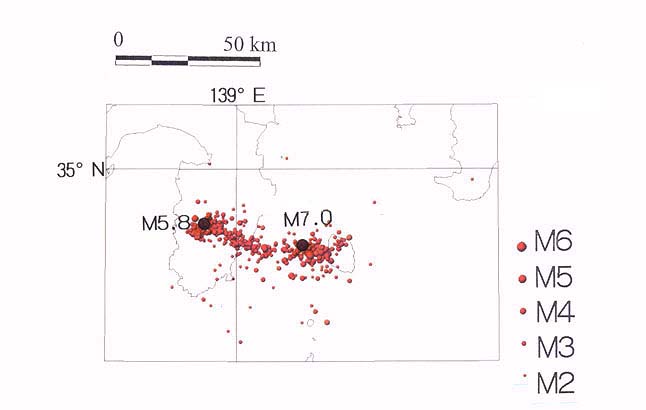
M 7.0 shows the magnitude and the hypocenter of the main shock and M 5.8 those of the largest aftershock.
[Compiled from Matsu'ura, et al. (1988)]