Figure4-28 Distribution of aftershocks for the Earthquake far off the Coast of Sanriku (M 2 or larger, December 28, 1994 to January 27, 1995, depths of 100km or less).
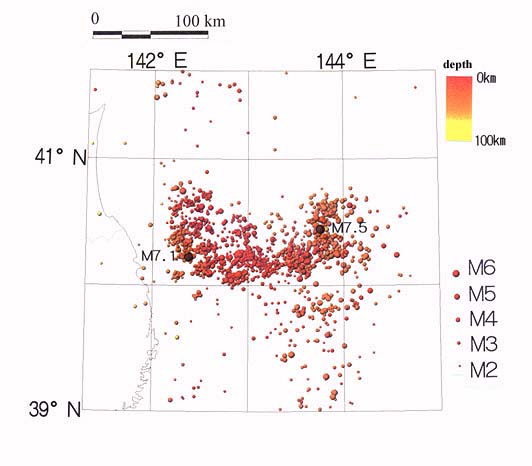
M 7.5 shows the hypocenter of the main shock and M 7.1 that of the largest aftershock.
[Compiled from data from Tohoku University]