Figure3-18 Distribution of aftershocks for the Earthquake off the Southwest Coast of Hokkaido (M 2 or larger and a depth of 30 km or less, 12 July-31 August 1993).
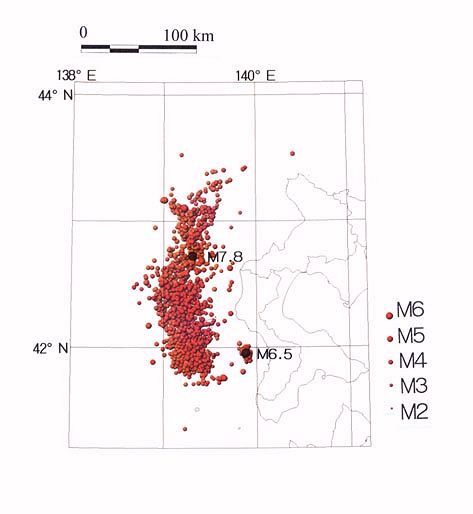
M 7.8 shows the hypocenter of the main shock, and M 6.5 shows the hypocenter of the largest aftershock.
[Compiled from data from Hokkaido University]