Figure2-4 Integrated graph of the frequency of earthquakes of M 6 or greater in the Japanese archipelago and surrounding areas (1885-1995, depths of 100 km or less).
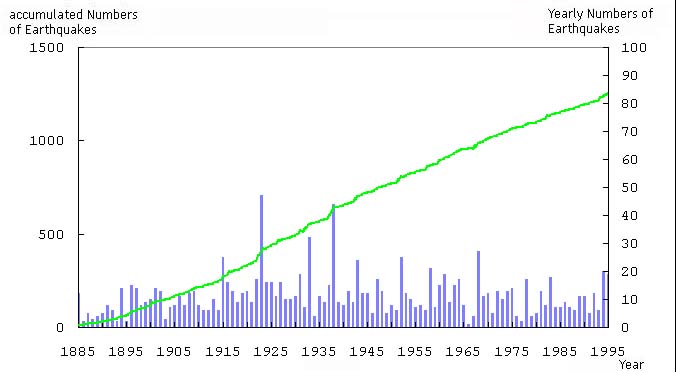
The frequency for one year (bar graph) and the cumulative frequency (line graph) are shown for the earthquakes shown in Fig. 2-3.
[Source: See end notes.]